Dashboards
Each team member has a dedicated dashboard at Events → Dashboards in the top menu. Dashboards are server-rendered pages — no app required, work on mobile. This page is the gallery of all four, so you can see what your peers see and what your own role surfaces.
What this is / Why you'd use it
Every role in Blaqbook has its own dashboard — a single page that summarizes what your job cares about. The executive sees overall revenue and audience trends; the manager sees a 60-day production radar plus tonight's checklist; the finance persona sees a KPI row, unpaid bills, and per-event profit; the door crew sees a giant OPEN SCANNER button and a live check-in count.
You don't pick which dashboard to use — Blaqbook shows you the one matching your assigned role group (Crew & HR covers how those roles get assigned). All four live at Events → Dashboards in the top menu, and they're server-rendered web pages, so they work on mobile without an app.
This page is the gallery of all four, so you can see what your peers see and what your own role surfaces. Jump to the section that matches your role: Executive, Manager, Finance, Door.
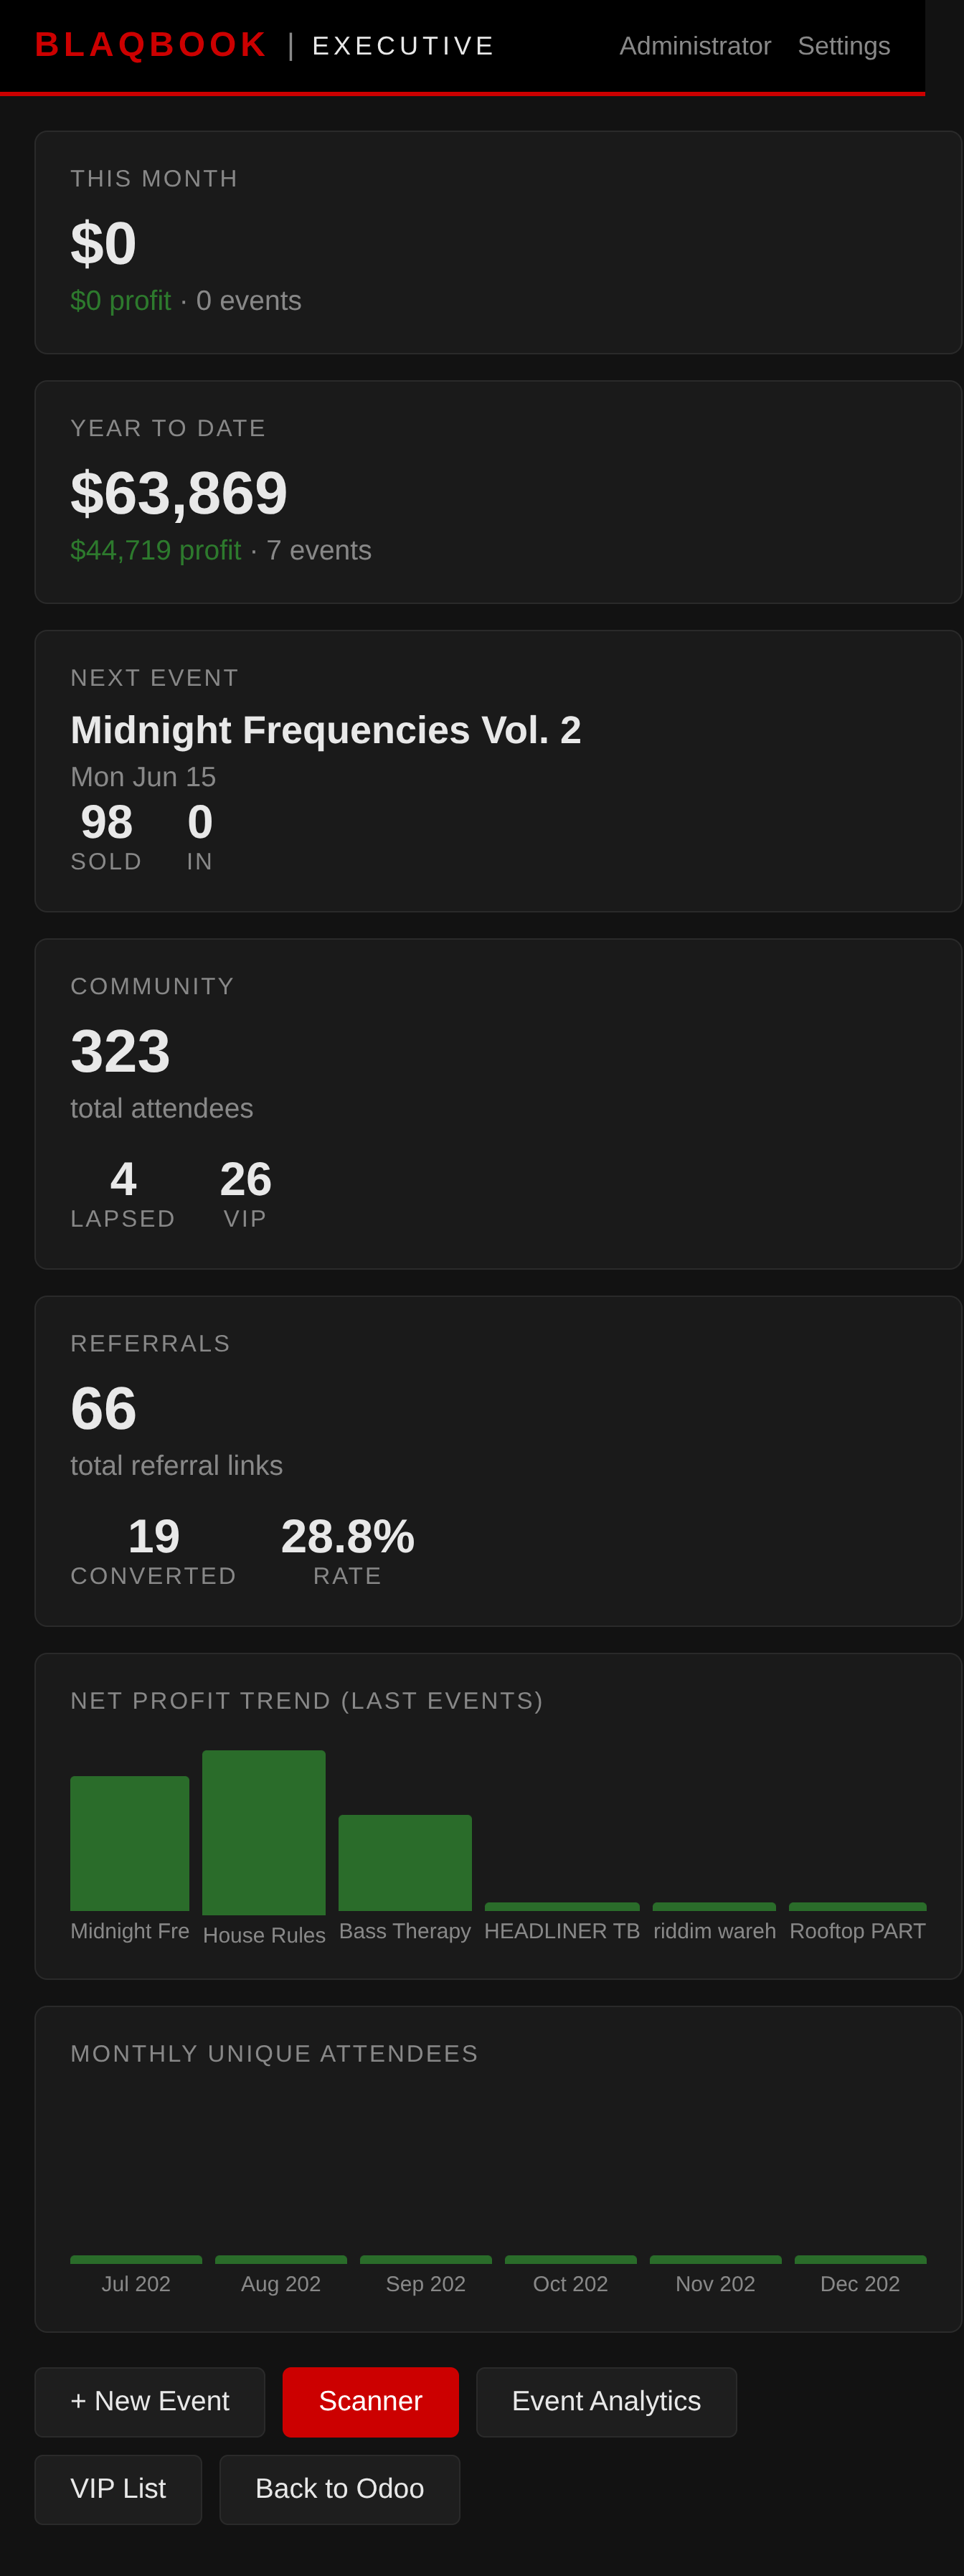
Executive Dashboard
/blaqbook/dashboard/executive — Executive group only.
- This Month / YTD — total revenue and net profit from all events in the period
- Next Event — name, date, tickets sold, check-ins so far
- Community — total attendees in the system, lapsed count (no event in 90 days), VIP count
- Referrals — total referral codes, conversion count, conversion rate (configured in Events)
- Revenue Trend — CSS bar chart of net profit for the last 6 completed events (red = loss, green = profit)
- Monthly Attendance Trend — unique attendees per month for the last 6 months (your repeat-customer pulse)
- Quick Actions — links to New Event, Scanner, and Analytics
Reading this dashboard
This dashboard is for weekly or monthly review, not daily standups. The numbers move slowly — revenue and net profit accumulate over the month, the Next Event card swaps when one show ends and the next is N days out. Glance habits:
- Monday morning ritual. Compare This Month / YTD against where you were a year ago. The Revenue Trend chart tells you whether last weekend was a one-off red bar or the third red in a row (a slide).
- Next Event card functions as a "two weeks out" sanity check. If tickets sold is well below the same point on prior events at the same lead time, marketing is underweight.
- Community → lapsed count trending up is a leading indicator the audience is aging out. Pair with the Lapsed reactivation walkthrough when it starts moving.
- Referrals. Conversion rate is the honest measure. Total referral codes can grow without conversions growing — that's bad. Watch the ratio, not the absolute count.
This dashboard does NOT show you tonight's check-ins or this week's vendor bills. Those are on the Manager and Finance dashboards respectively.
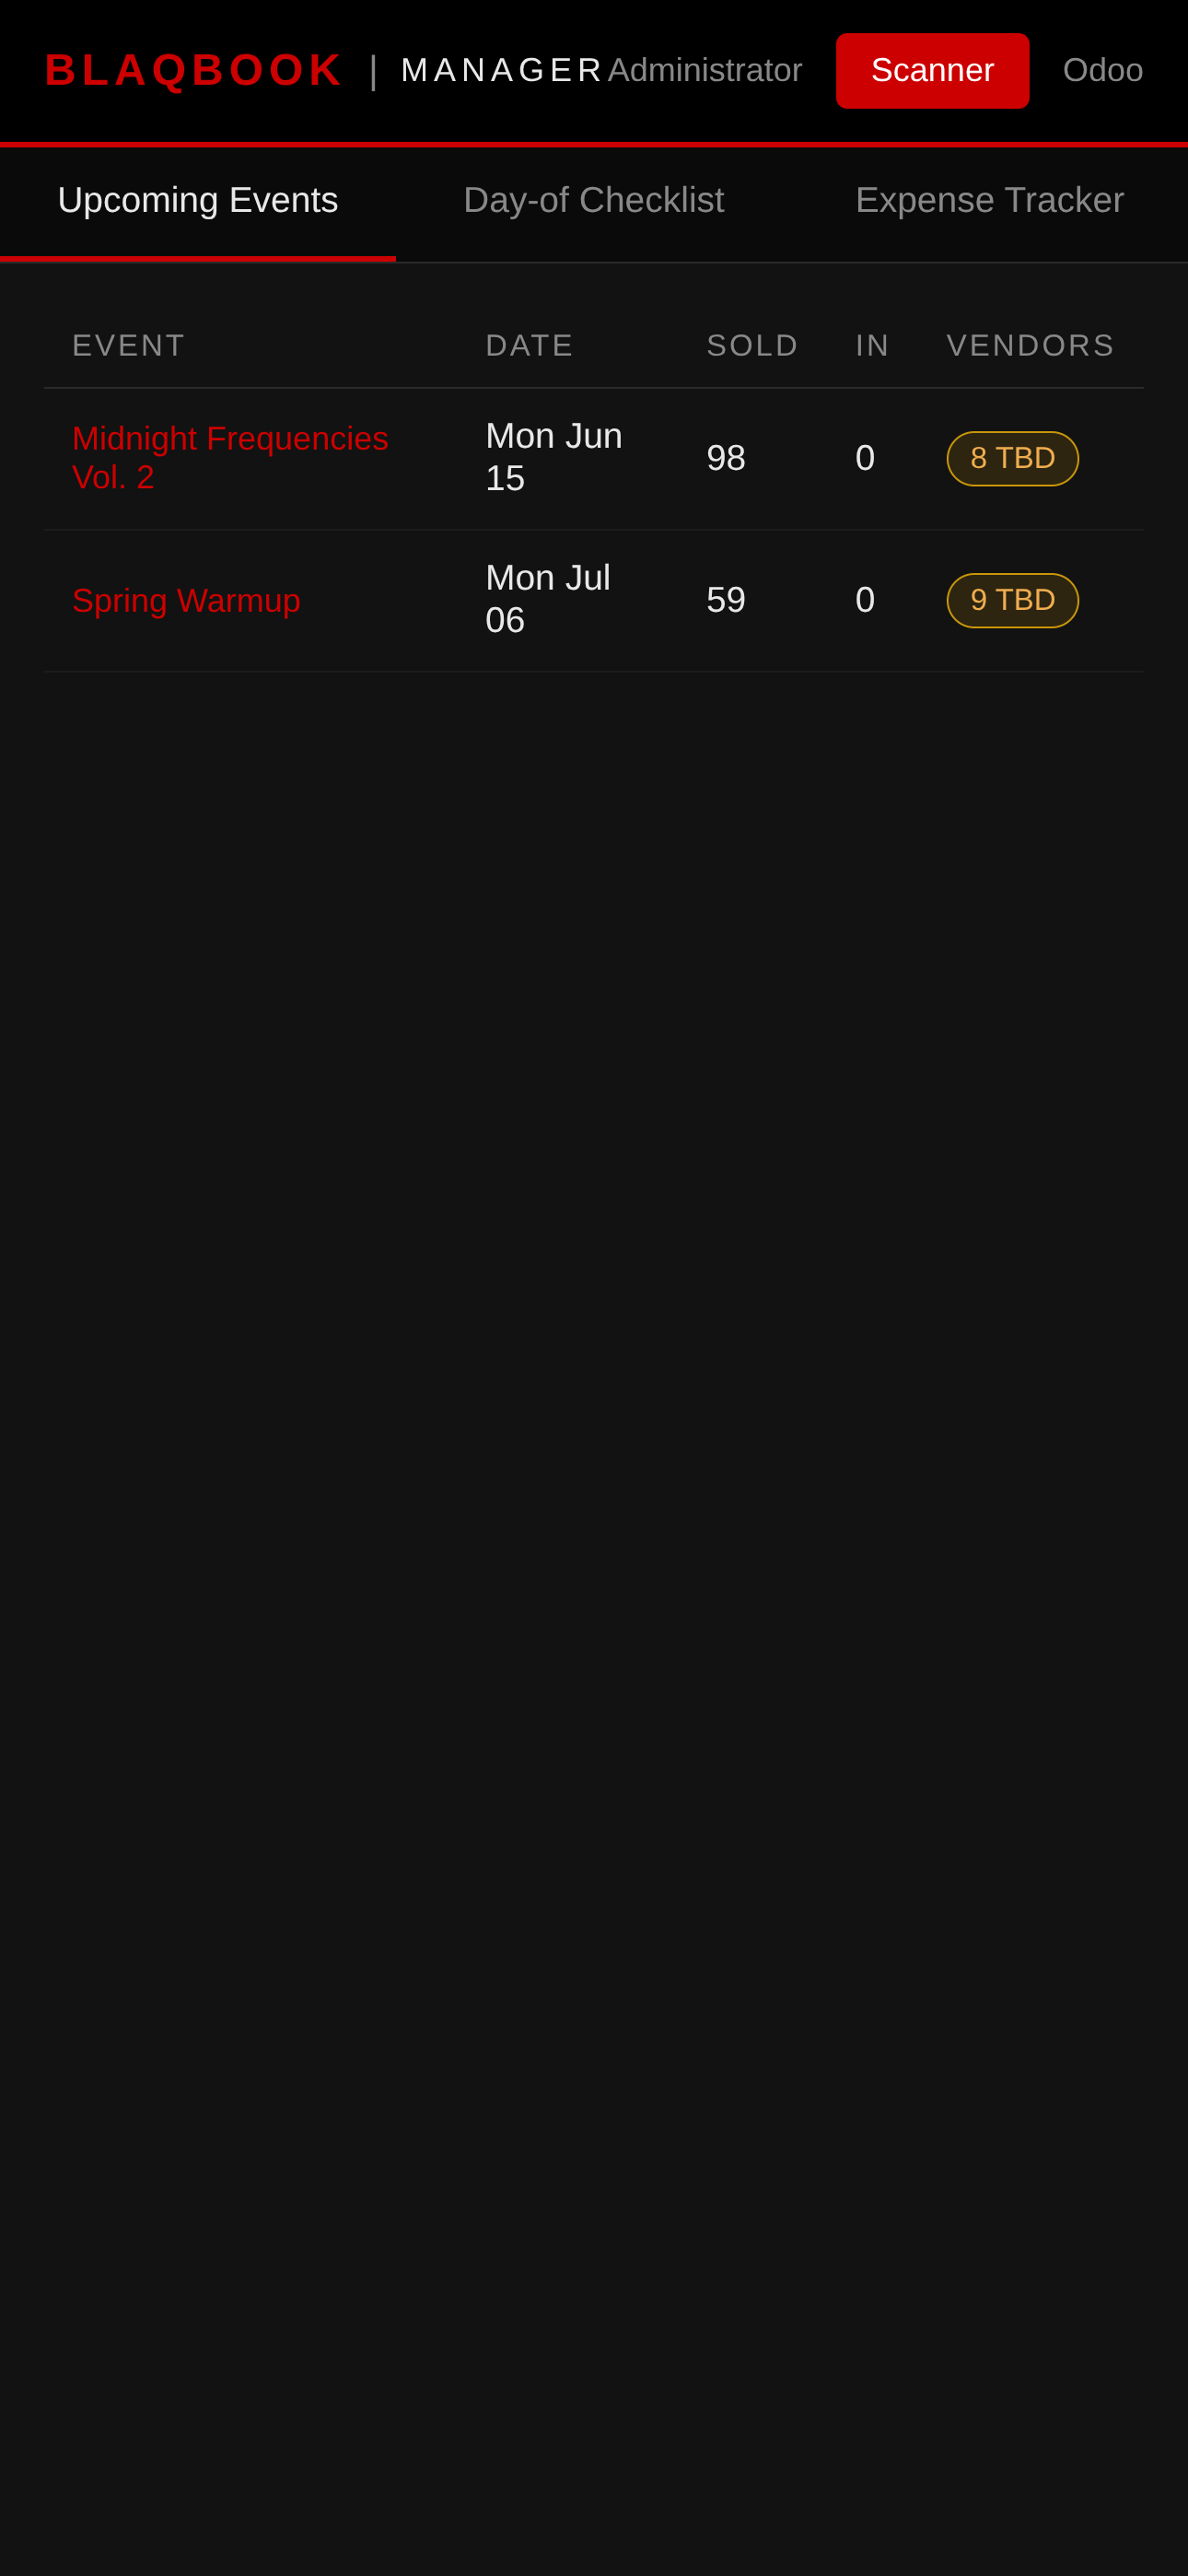
Manager Dashboard
/blaqbook/dashboard/manager — Executive and Event Manager groups.
Three tabs (click to switch):
- Upcoming Events — next 60 days; each row shows ticket count, check-in count, and a vendor coverage badge (green = all confirmed, amber = some TBD)
- Day-of Checklist — select an event from the dropdown; 8 checklist items grouped by Pre-Event / On-Site / Post-Event; click any item to toggle it done/undone (saves instantly, no page reload)
- Expense Tracker — all unpaid vendor slots across upcoming events; click Mark Paid to record payment (row fades out, no page reload)
Reading this dashboard
This dashboard is for daily use during event production weeks. The three tabs are three different time horizons; flip between them as the week's tempo demands.
- Upcoming Events tab. Your 60-day radar. The vendor coverage badge is the key signal — green = contracts locked, amber = TBD. Wednesday before an event, an amber badge means someone's making phone calls Thursday or you're scrambling Friday morning.
- Day-of Checklist tab. Live during event day. The eight items aren't gospel; they're a memory aid. Toggle as crew confirms — items save instantly so the manager can stay on the floor with a phone.
- Expense Tracker tab. Where unpaid vendor bills accumulate over the weekend. Most managers triage Monday morning; Mark Paid removes the row without a batch refresh.
If you're flipping between tabs more than twice per day, the cadence is wrong. Production weeks: live on this. Off weeks: ignore it.
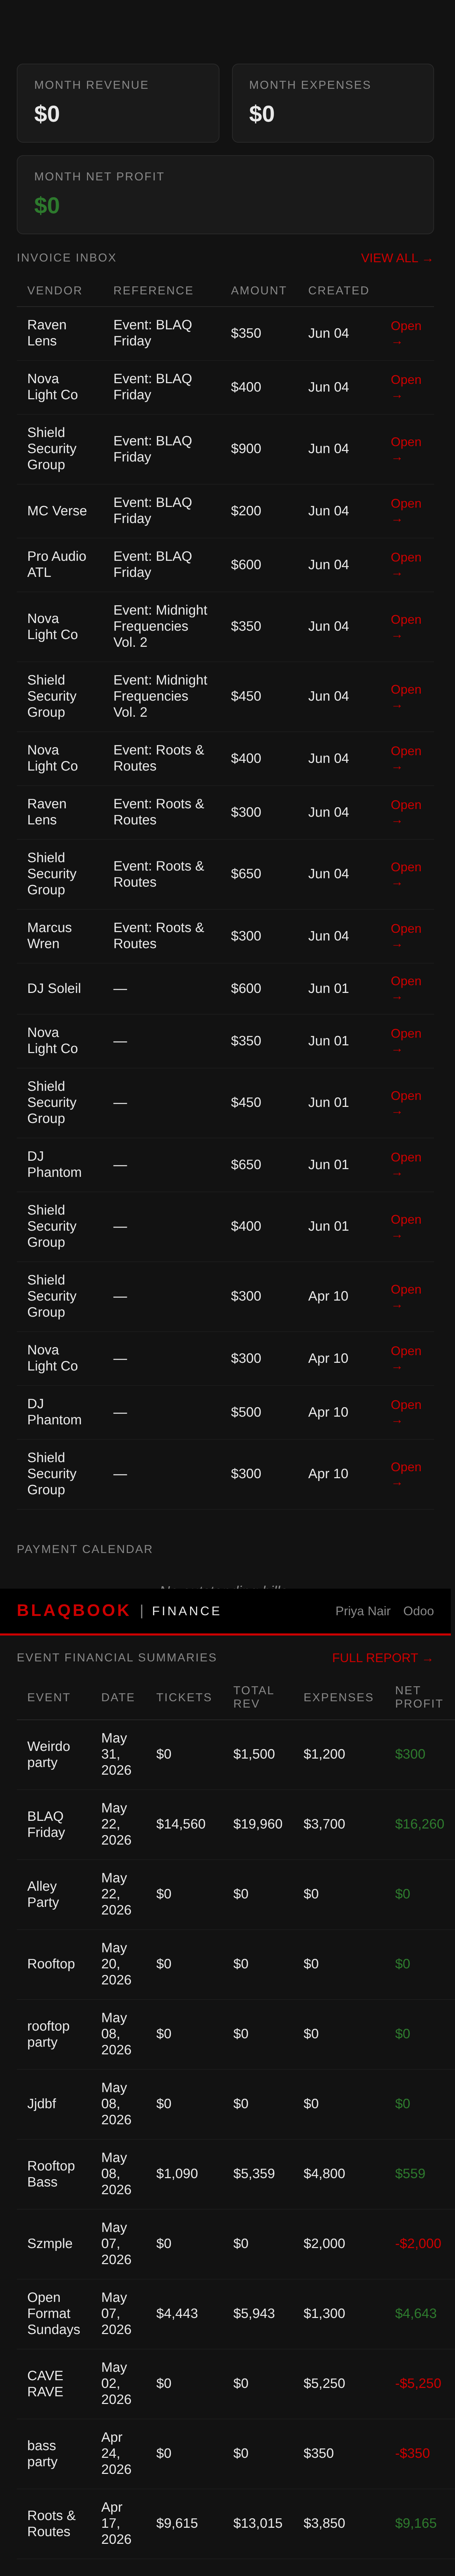
Finance Dashboard
/blaqbook/dashboard/finance — Executive and Finance groups.
- KPI Row — this month's revenue, expenses, and net profit at a glance, one number each; overdue bill count appears in red if any exist
- Invoice Inbox — draft vendor bills waiting for review; click Open → to go directly to the bill in Accounting
- Payment Calendar — all posted/unpaid bills sorted by due date; past-due rows highlighted in red; click Pay → to open the bill
- Event Financial Summaries — one row per completed event showing ticket revenue, total revenue, expenses, and net profit (red = loss) — see Finance for the deeper drill-down
Reading this dashboard
This one is for the Finance persona's weekly close. The KPI row is the headline; the lower sections are the actionable work.
- KPI row. Monthly snapshot. If overdue bill count is red, that's the first stop — those are bills past due date that vendors are about to ping you about.
- Invoice Inbox. Draft vendor bills not yet reviewed. Friday's event probably produced 5–8 drafts via Create Draft Vendor Bills. Click Open → to confirm details and post.
- Payment Calendar. Posted unpaid bills sorted by due date. Red rows = past due. Most operators batch-pay weekly (e.g., every Tuesday) — work top-down on this list until the pay window is exhausted.
- Event Financial Summaries. One row per completed event. The color-coded net profit column is your "did this event work financially?" answer at a glance. Red rows deserve a click-in.
Weekly rhythm: Monday review KPI row, Tuesday batch-pay from the Payment Calendar, end-of-month reconcile Event Financial Summaries against Stripe payouts (see Reconciling a Stripe Payout).
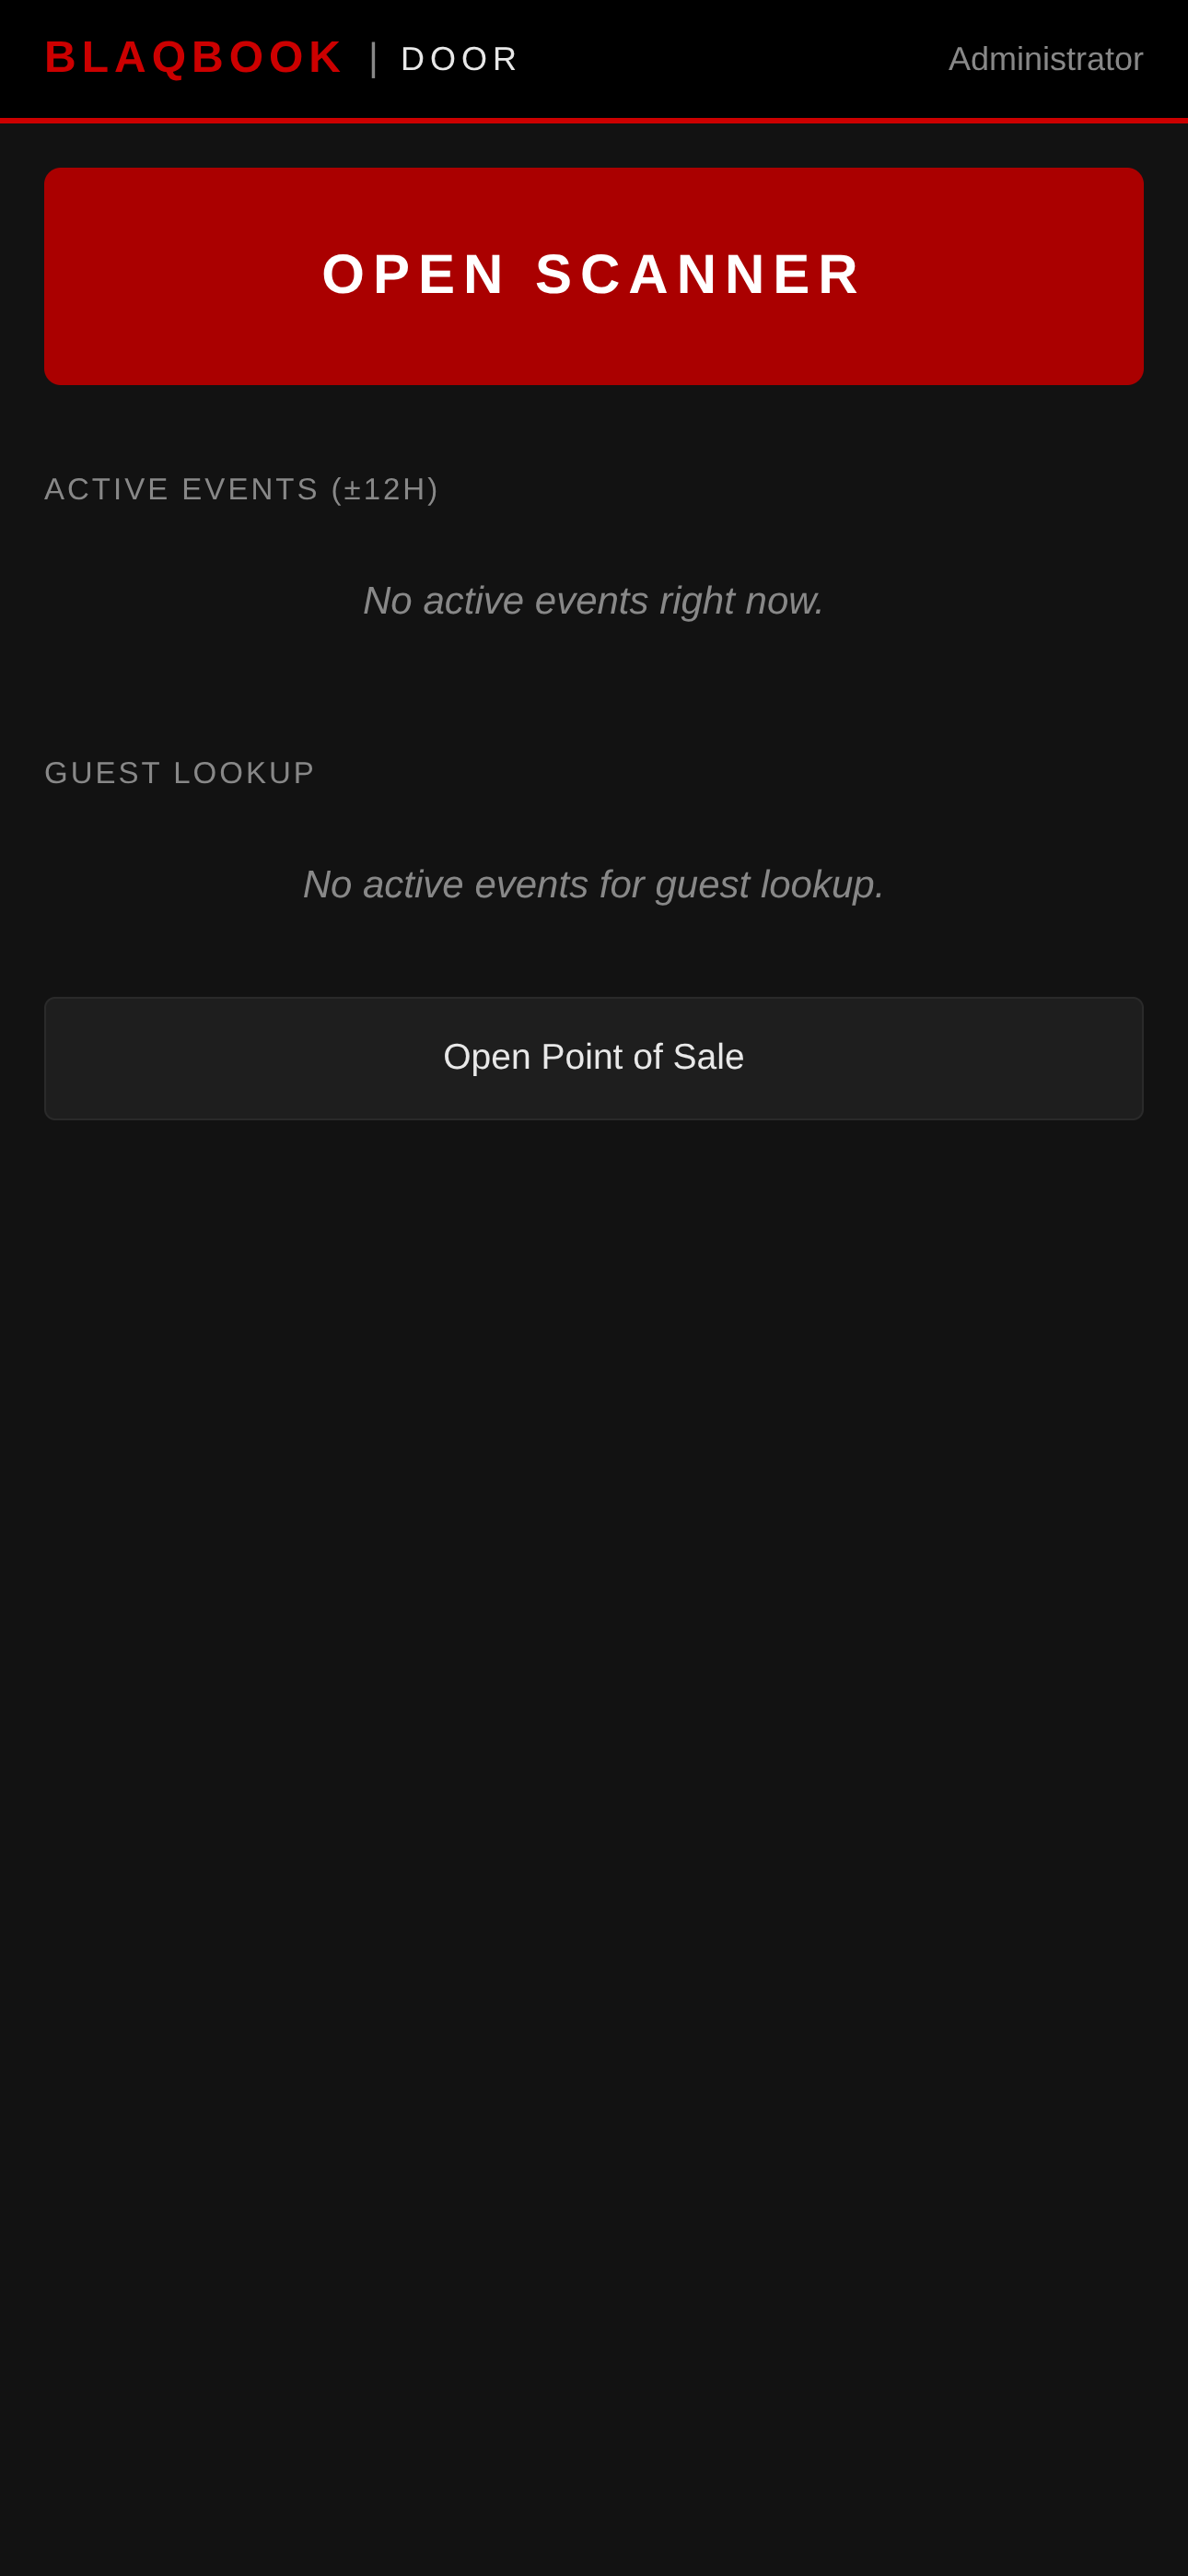
Door Dashboard
/blaqbook/dashboard/door — All groups including Door / Crew.
- OPEN SCANNER — large red button, tap to go directly to the QR scanner
- Active Events — events happening now (±12h window) with a progress bar showing check-ins vs. capacity
- Guest Lookup — type a name (2+ chars) to search the guest list for the selected event; shows check-in status
- POS Link — button to open the Point of Sale session for door ticket sales (see eCommerce)
- Auto-refreshes check-in counts every 30 seconds — no manual reload needed
Reading this dashboard
This isn't a dashboard in the analytical sense — it's a live operator console for event night.
- OPEN SCANNER button is the whole reason the page exists for door / crew. One tap, you're in the scanner. Deliberately the largest, most-tappable element on the page.
- Active Events panel shows what's happening NOW (±12h window). On a quiet weekday it's empty; that's correct. On event night the progress bar fills as the line moves.
- Guest Lookup is for the manager working the floor with a backend tablet — type a name, results appear. This is what handles "I bought a ticket but can't find the email" (see Red X Triage).
- POS Link opens the POS session for at-the-door sales (see Friday-Night POS).
- 30-second auto-refresh updates check-in count and progress bar without a page reload. Useful for the bar manager pacing inventory and for the executive who wants to know "are we busy?" without showing up.
Outside event nights, this dashboard is intentionally sparse. That's the design.
Related
- Events — create and publish the events that feed every dashboard
- Door Scanner — the entrance-side flow the Door Dashboard launches into
- Finance — the deeper P&L and vendor-bill workflows behind the Finance Dashboard